Figure 1 represents a marketing data flow diagram that incorporates local government resources and links them to the solar-powered water pump seller and farmer.
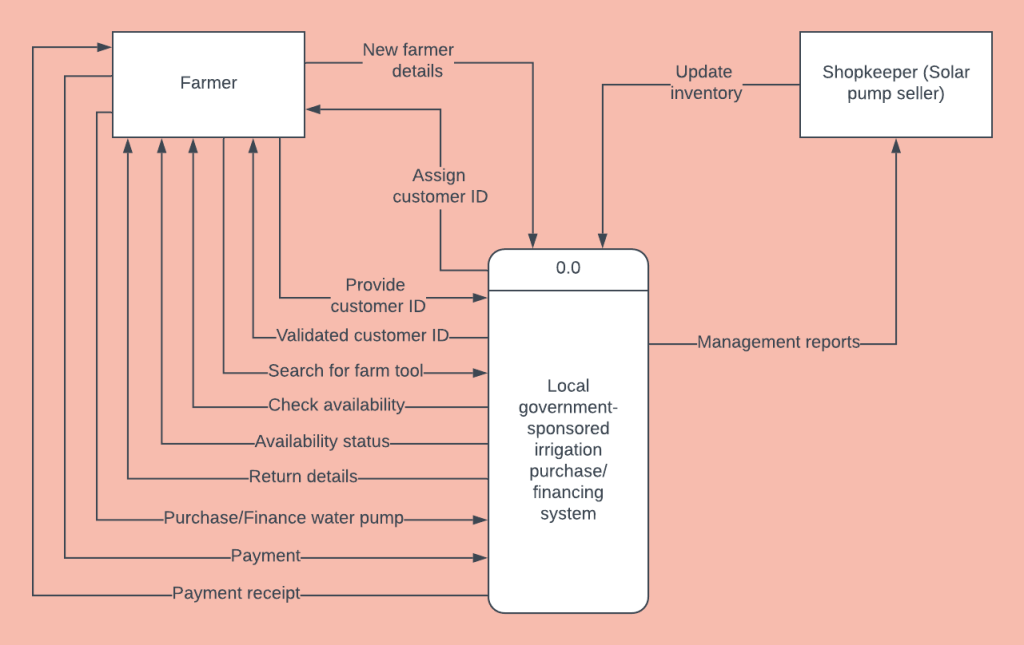
Figure 1. Marketing data flow diagram for solar-powered water pumps sold through local government to farmers in India.
The above system not only gives an overall model for how local government would interact with farmers and retailers. It also provides an idea of how all these systems would interface and share information. This is critically important to achieve business intelligence solutions. Not the least of which is monitoring participation in the program and comparing that participation to things like profit change over time.
Post #5 in this series explores a quantitative data analysis.
