In conclusion, this week’s series explores why Blue Apron simply must implement a comprehensive food safety program. Not only does it protect the lives of people who are nourished by meal kits, but it also protects the longevity of the company and its employees. Blue Apron has to stand for more than meal kit profits but instead providing healthy food through a process it is proud of.
The marketing effort must highlight everything Blue Apron has implemented. But it can’t forget to show the human touch through business analysis, personal stories, and strongly highlighting its renewed commitments and company policies.
[Unless a citation/reference is provided, data and the scenario for this week’s posts are fictionalized in order to show various business intelligence concepts and/or techniques.]
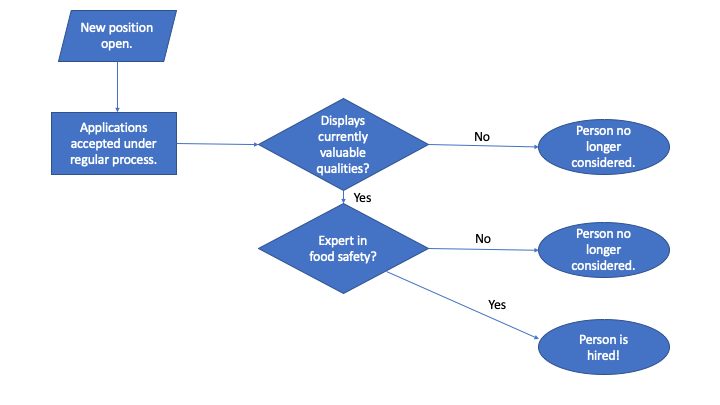
One of many new processes that should be implemented for new Blue Apron safety measures is a management vetting process. While the actual process has many more steps, Figure 1 shows the process at a high level.
Figure 1. Suggested new Blue Apron management vetting process.
This new process incorporates the appropriate food safety measure to keep customers safe and avoid the threat to Blue Apron’s bottom line from food contamination reports.
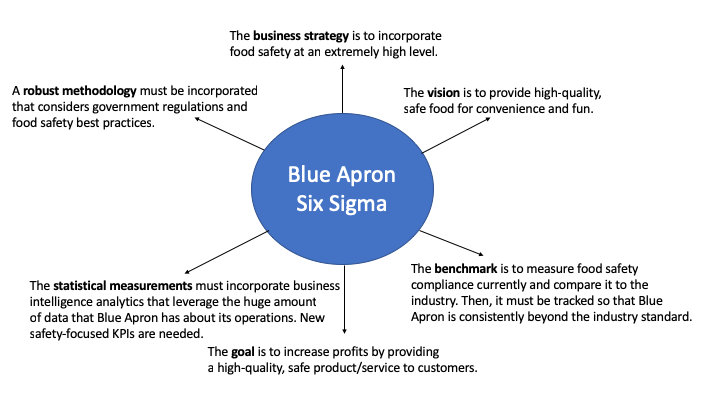
Total quality management (TQM) has a very popular approach called Six Sigma that has roots in manufacturing and service industries. This makes it a great fit for Blue Apron.
Figure 1 shows the appropriate Six Sigma implementation.
Figure 1. Blue Apron Six Sigma implementation.
Post #5 in this series explores a process analysis.
To improve quality, it takes effort from all levels of the organization, including management. Everyone has to work together to set the tone for the culture, and this is especially critical for improving food safety culture, like the improvements outlined by Brianne Shelley (Shelley, 2015):
Maintain a food safety culture team.
Make sure you have a customer focus.
Communicate effectively.
Measure and assess the food safety culture regularly.
Engage and involve employees.
Train and reinforce food safety.
Make a long-term commitment to sustain and improve food safety.
To accomplish the above goals, Blue Apron must implement Deming’s 14 points of improved total quality management (TQM). Table 1 shows how Blue Apron must implement each.
1) Improvement of products and services is created through a multi-disciplinary food safety culture team committed to consistent high quality.
8) Fear has no place at Blue Apron. Everyone is simply held accountable to their actions at a high level.
2) The new philosophy of Blue Apron incorporates the highest level of safety.
9) Barriers between staff areas are broken down to seed mutual support and an atmosphere of helping each other succeed.
3) Mass inspection is no longer a part of the structure. More frequent and rigorous inspection is absolutely required.
10) Slogans no longer have a place at Blue Apron.
4) A vendor or supplier’s prices are not enough to become a part of the Blue Apron family. Everyone must pass rigorous vetting.
11) Numerical quotas of meal kits to produce are a thing of the past. We’re looking for quality, not simply quantity.
5) Improvement efforts will never end.
12) All barriers to workmanship pride are removed.
6) New training initiatives around food safety are implemented.
13) Education and retraining around food safety gets implemented company-wide. Including at the highest levels.
7) Every person in a position of leadership must actively assert safety initiatives.
14) Actions to accomplish transformation will be tracked and rewarded.
Table 1. TQM points as applied to Blue Apron.
Post #4 in this series explores a Six Sigma approach.
Blue Apron is unfortunately susceptible to a variety of factors that threaten its longevity. Figure 1 shows a fishbone diagram that provides a variety of potential cause-and-effect relationships that could negatively impact Blue Apron operations.
Figure 1. Fishbone diagram of potential cause-and-effect relationships that could lead to a dangerous contamination event.
Any single factor might be a temporary problem or be caught before someone gets hurt. However, a combination of problems in which one causes the next (or causes the next to be missed) can harm someone. For example, a single employee feeling overworked for a week may not be a problem and resolve itself. But if the employee is overworked and doesn’t notice someone introducing a chemical into the food supply, that’s a terrible problem. In another case, perhaps there’s an empty position. It gets filled 3 months later, but in the meantime, no one noticed that the new supplier (forced into place because of a supply chain change) had multiple complaints lodged against it for poor quality, and someone gets sick. Any combination of these risks can put Blue Apron right back at square one, or even worse, hurt someone.
Post #3 in this series explores quality control measures.
This week’s blog series examines the meal kit industry through the lens of Blue Apron. In 2012, Blue Apron was one of the first meal kit companies to enter the market. Earlier iterations of today’s meal kit industry exist, but the current version still functions primarily as a large-scale e-commerce industry, despite recent forays into the brick and mortar grocery segment. By shipping fresh meat and produce across the country (and in some cases, internationally) with easy recipes and a novel cooking experience for busy professionals, parents, specialty diet consumers, and other customer segments, the industry has seen extreme growth in a short amount of time. And in this case, Blue Apron took only three years to be valued at $2 billion (Filloon, 2019).
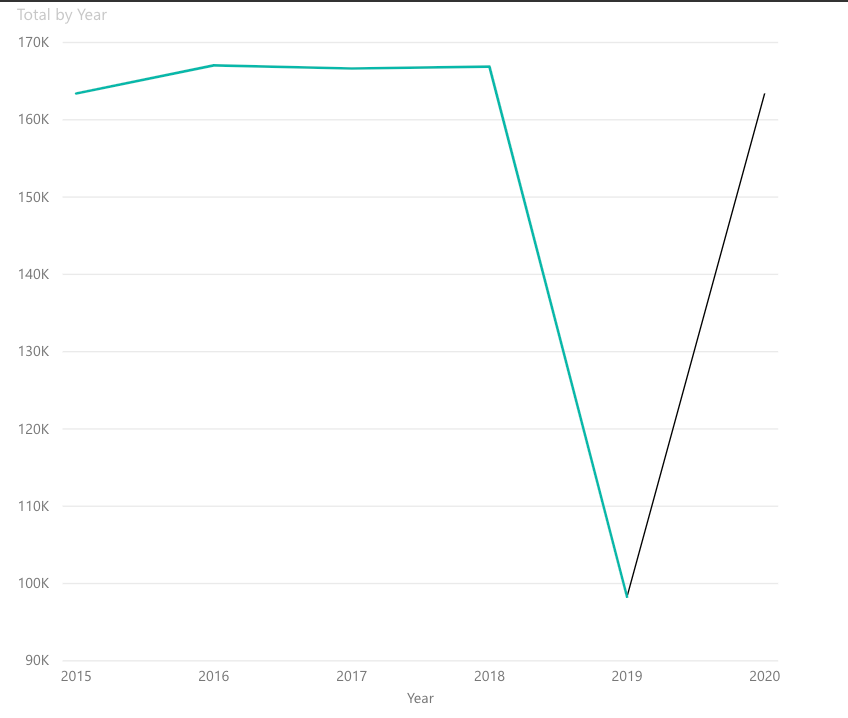
Figure 1 shows Blue Apron’s projected growth over the past year.
Figure 1. Blue Apron’s drop in a select, representative sample segment of the country with projected growth in 2019 previously reported to shareholders.
Growth was expected to be on an upward trend in 2019, which was excellent. With new brand partnerships and changes to the supply chain it seemed inevitable. However, the growth projections predated reports of a food contamination scare at Blue Apron. [Fictional scenario for the purposes of this assignment.] Luckily, the affected food was identified, disposed of, and no one was harmed. But since the report surfaced, profits actually dropped significantly, the opposite of projections. Blue Apron cannot afford to continue the deep dive seen in profits in the last year.
Blue Apron is a high-profile brand that has suffered significant and public losses, since it is the only publicly traded meal kit company. Therefore, much like a condominium in a rocky real estate market, Blue Apron will be hit harder than other brands and also take longer to recover. This was proven when a different meal kit brand had a similar scare that sent Blue Apron’s profits downward simply by association of being in the same industry, as seen in Figure 1 last year. Therefore, to avoid another contamination problem and insulate itself from problems at other meal kit companies, Blue Apron must implement and market a sizable food safely culture initiative. It will require major, highly publicized enhancements to food safety measures, corporate policies, and employee training.
Post #2 in this series explores a risk avoidance analysis that could contribute to shoring up Blue Apron’s efforts in this area.
It’s helpful to take a deeper look into the subscriber base in order to assess risk. As seen in Table 1, 40% of meal kit subscribers are parents while 30% of subscribers are high-income. (In the below table, P=Parents and H=High-income.)
Table 1. Probability Matrix of parents and high-income subscribers.
So it turns out that 25% of all meal box subscribers are both parents and high-income earners. This is the ideal market segment for Sun Basket to maintain and grow its position in the marketplace.
These are important metrics because, as outlined in last week’s posts, targeting high-income women is ideal, and it’s clear that parents are a significant segment of this population as well. There is some risk, however, in the high turnover of meal kit customers. Additionally, 25% of the market can be challenging to identify and enhance a relationship with. Though the online marketing efforts outlined in last week’s posts could easily be tailored to this segment, especially through Facebook ad targeting. Ads could be developed that spoke specifically to this group and mitigated the potential risk to bring in a less-than-idea customer who is more likely to unsubscribe or find the service isn’t to their liking.
[Unless a citation/reference is provided, data for this week’s posts are fictionalized in order to show various business intelligence concepts and/or techniques.]
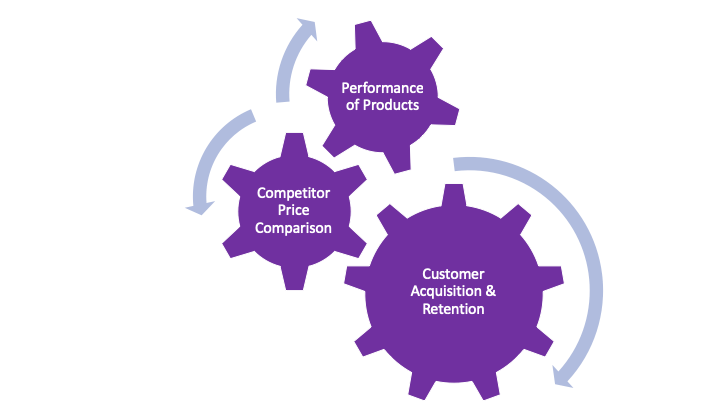
Of note is the customer acquisition and retention gear in Figure 1. It’s the largest gear quite intentionally because the meal kit industry is so susceptible to customer turnover. It’s very important for customers to feel happy and invested in the brand, which is a significant driver of future sales.
Additionally, precooked and frozen dishes is a growing segment of the market. An increasing number of customers want even more ease to the dinner table through entrees that only need to be heated up instead of prepared after a long day of work. This means that ads should not only focus on the affluent parent (particularly a mom) but also customers who want the ease of a healthy meal that can be heated up in the oven or microwave.
Even though the meal kit industry celebrates great popularity, this doesn’t mean that evaluating company books isn’t important. It is the companies that are most effective in managing their books that avoid accounting problems and flawed policies that leave the company vulnerable. Therefore, management must routinely evaluate financial aspects like a cash flow analysis to stay on top of trends that threaten to undermine efforts in all other areas of the organization.
Tables 1 and 2 show a cash flow analysis presented in thousands.
Sun Basket 2018 Cash Flow Analysis (Part 1)
(All figures in thousands)
January
February
March
April
May
June
July
Cash at Start of Month
5,000
3,340
3,080
2,220
1,960
1,700
–740
Cash Coming In
Sales Paid (75%)
7,500
7,500
7,500
7,500
7,500
6,000
6,000
Collections of Credit Sales
2,000
2,000
2,000
2,000
2,000
1,600
1,600
Loans & transfers
0
0
0
0
0
0
0
Total Cash In
9,500
9,500
9,500
9,500
9,500
7,600
7,600
Cash Going Out
Inventory
4,500
4,500
4,500
4,500
4,500
4,500
4,500
Rent
1,000
1,000
1,000
1,000
1,000
1,000
1,000
Wages
4,000
4,000
4,000
4,000
4,000
4,000
4,000
Utilities
100
100
100
100
100
100
100
Phone
30
30
30
30
30
30
30
Insurance
1,200
0
0
0
0
0
0
Ads
200
0
0
0
0
280
0
Accounting
130
130
130
130
130
130
130
Miscellaneous
0
0
600
0
0
0
0
Loan payments
0
0
0
0
0
0
0
Taxes
Total Cash Out
11,160
9,760
10,360
9,760
9,760
10,040
9,760
Cash at End of Month
3,340
3,080
2,220
1,960
1,700
-740
-2,900
Table 1. Sun Basket 2018 cash flow analysis, part 1.
Sun Basket 2018 Cash Flow Analysis (Part 2)
(All figures in thousands)
August
September
October
November
December
Cash at Start of Month
–2,900
–6,410
–4,770
–5,030
–5,290
Cash Coming In
Sales Paid (75%)
5,250
9,000
7,500
7,500
11,250
Collections of Credit Sales
1,400
2,400
2,000
2,000
3,000
Loans & transfers
0
0
0
0
0
Total Cash In
6,650
11,400
9,500
9,500
14,250
Cash Going Out
Inventory
4,500
4,500
4,500
4,500
4,500
Rent
4,000
4,000
4,000
4,000
4,000
Utilities
100
100
100
100
100
Phone
30
30
30
30
30
Insurance
0
0
0
0
0
Ads
0
0
0
0
0
Accounting
130
130
130
130
130
Miscellaneous
400
0
0
0
200
Loan payments
0
0
0
0
0
Taxes
Total Cash Out
10,160
9,760
9,760
9,760
9,960
Cash at End of Month
-6,410
-4,770
-5,030
-5,290
-1,000
Table 2. Sun Basket 2018 cash flow analysis, part 2.
Cash flow must routinely be evaluated, ideally through a monthly discussion among the company’s management team with detailed analytics dashboards and/or reports available from the accounting department. These oversight measures are very important to catching data trends early that could indicate a larger problem. For example, in the above tables, there would be a big difference between catching the downturn in cash at the start of July versus not seeing the problem until an end-of-year report. Seeing the problem earlier would allow management to investigate the problem and implement a strategic plan to reverse the downward trend.
Post #11 in this series explores a sales analysis.
Another opportunity for increasing agility and reducing waste is in the area of operations. While it is good to expand the capacity for revenue, it’s also good to reduce operations costs wherever possible, which can be a simple way to increase a company’s bottom line.
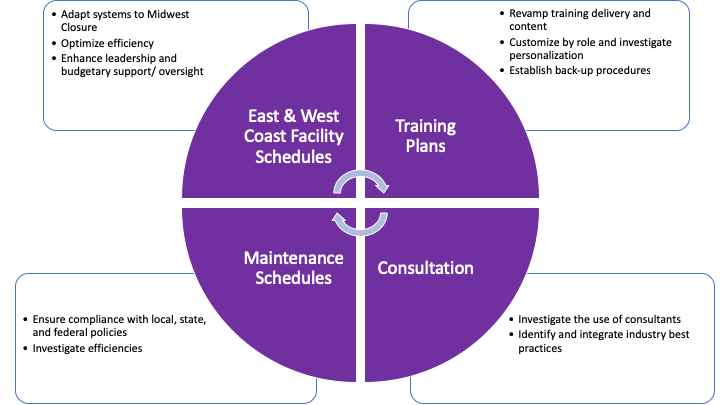
Figure 1 shows the areas within which there’s an opportunity reduce waste and increase efficiencies in a way that supports employee satisfaction.
Figure 1. Key ingredients of the Sun Basket operational plan.
Of note are the categories of East & West Cost Facility Schedules and Maintenance Schedules. In the first case, some time and attention should be invested in making sure the coasts are running efficiently since the Midwest location has been closed. There may be systems that need updating to reduce strain on databases or other business intelligence-related systems. Additionally, by implementing the leadership training suggested in the previous post, employees are expected to become more productive and efficient because they’ll care more about their environment and feel more of an affinity to management.
As for maintenance schedules, its critically important that local, state, and federal policies are followed thoroughly. This is not just because of the fees that can be charged to Sun Basket for compliance failures. But it’s also because not conducting business in line with these policies creates the opportunity for inefficiency, which also cuts into profit.
Post #10 in this series explores a cash flow analysis.